Loading... Please wait...


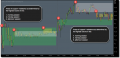
Point and figure charts: now available for the first time on ThinkorSwim. Accurate and easily configurable. Available exclusively from Fun with ThinkScript.
- I would like to thank Fun with Think Script. I was looking for a point and figure chart and so far its been great. I had a few questions and Robert gave me a quick detailed response. Thanks
Point and Figure Charts
Get the finest, and only, PnF charts available for ThinkorSwim
- If I were ever shipwrecked on a desert island with only one chart to guide me through the markets, it would have to be a Point and Figure chart. No other single chart has the ability to cut through the chaff and show what is really going on.
Jeremy du Plessis
I was recently asked to look into the possibility of developing point and figure charts for ThinkorSwim. When I started researching them, I found requests going back almost 10 years for these charts to be made available on the TOS platform.
I am pleased to announce that the wait is over. Point and figure charts are officially available now.

Box size based on Average True Range (ATR)
ATR is based on the average amount price moves over the period selected, which is ideal for setting the box size. The ATR value adjusts when the time frame of the data changes. The ATR for 1 minute or 5 minute data will be significantly less than that for daily data and consequently the box size will be smaller, which is exactly what you want and expect it to be. The reason is that the true range from one minute to the next is much smaller than that of one day to the next.
Percentage box scaling
This uses box sizes that are a fixed percentage of the stock’s price. For example, if a chart used 5% scaling and the stock’s price is $100, the box size for that part of the chart will be $5.00.
User-Defined box scaling
This setting allows users to set the box size. A larger box size will result is more filtered price movements and fewer reversals. A smaller box size will result in less filtered price movements and more reversals.
The following table of recommended box sizes is from the book “Point & Figure Charting” by Tom Dorsey.
| Price Range | Box Size |
|---|---|
| Under 0.25 | 0.0625 |
| 0.25 to 1.00 | 0.125 |
| 1.00 to 5.00 | 0.25 |
| 5.00 to 20.00 | 0.50 |
| 20.00 to 100 | 1.00 |
| 100 to 200 | 2.00 |
| 200 to 500 | 4.00 |
| 500 to 1,000 | 5.00 |
| 1,000 to 25,000 | 50.00 |
| 25,000 and up | 500.00 |


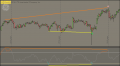
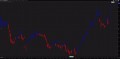
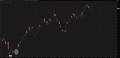
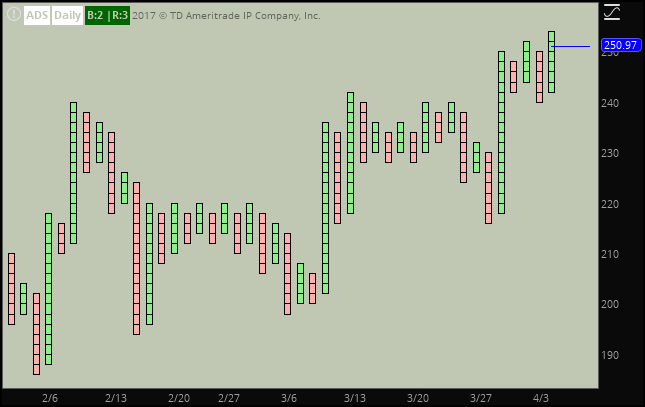
Additional screenshots highlighting the versatility of these charts across different time frames.
**Import note:** This indicator does not work with tick charts.